All robust platform can have a daunting data structure. With some, and in certain situations, you might not directly care about the intricacies. But if you are looking to create reports and visualization, identifying the complexities around data structure becomes quite important.
When working in Power BI, and connecting to Dynamics 365 Customer Engagement, the first step is to identify the entities and relationships that will help you to create relevant dashboards.
You could just ask a Dynamics developer to walk you through it, but that’s not always an option.
Back with older versions of Dynamics CRM, the SDK used to include these complex and large ERD diagrams. They were hard to read, and too stuffed of information. I remember spending time cleaning them up and removing non-relevant entities and relationship so I can present a small portion in documentation.
But fast forward to today. As a Power BI resource that is just starting to look at leveraging data from Dynamics 365, you can start first by looking at the entities. You can find a listing of the entities in the SDK (available for 8.2 at this time).
Right under the SDK folder, you have an Excel spreadsheet called EntityMetadata.xslx
Opening this file on the Entities tab, you can order the records by EntitySchemaName (alphabetically) and browse through the entities available. Note that this will not include anything custom brought in by a third party solution or your own customizations.
There’s a lot of other good information in this file (can you say treasure trove?), like the field names on each entity and descriptions, as well as relationship metadata information. If you feel like tracing relationships manually, you could do it just from here. Not the most efficient way to spend the day though, but good to have.
What if you could have a little tool generate a quick visualization of the entities and their relationships? What if that tool would do just the sub-set you need?
Well, this has been around for a while, so you’re in luck. Since Dynamics 365 Customer Engagement is a metadata driven system, you can leverage that metadata to build an ERD. Welcome to the Metadata Diagram tool. It’s available for download from HERE.
The beauty of this is that you generate Visio ready ERD diagrams including all entities in your current state organizations. This allows you to capture al customization/configurations, as well as any 3rd party solution entities. Another bonus is that you can select only the entities you’re interest in, and the output will include them and those directly related.
The documentation on the DOCS site give you all the information you need to get started.
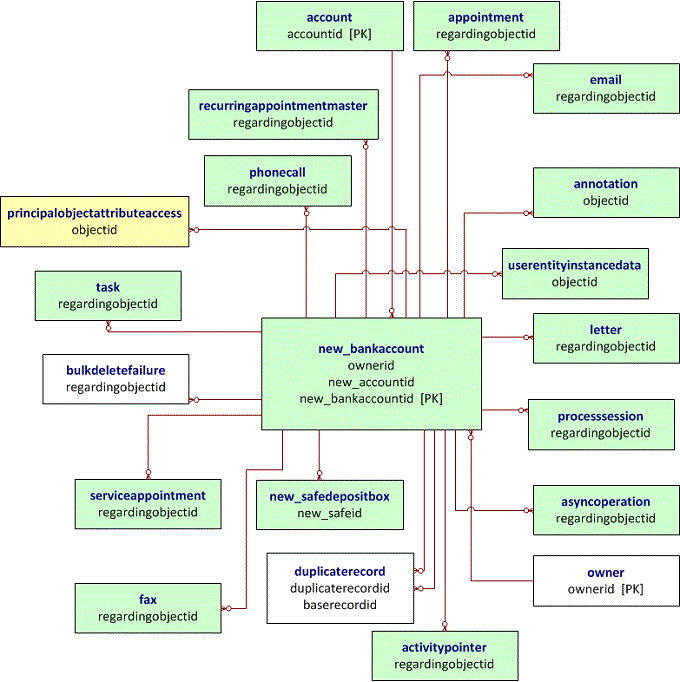
The following output screenshot is directly from the documentation page, and shows platform entities along with custom entities:

While this option will require you have access to a Visual Studio instance to build the app, there’s an even easier option here.
The XrmToolBox includes the Entity Relationship Diagram Creator. Here, you just select the related entities you want to report on, and you can define how complex should the output be (from a simple entity to entity to a more complex listing with fields and relationship names).
Play with it, use it, leave a note if you’ve learned something new!
Enjoy!


Leave a comment